When you open a browser, a text editor, and a music player all at once, operating system (OS) somehow manages to keep all three running smoothly. Switching between them so fast it feels like they’re all running simultaneously. But how does the OS remember where each program was, what it was doing, and what resources it was using? The answer is the Process Control Block (PCB).
What is a Process Control Block (PCB)?
When a process is created or installed, the operating system creates a data structure for it and stores it in protected kernel memory. Everything the OS needs to know about that process lives in this one structure: its identity, current state, what memory it’s using, which files it has open, and more.
Linux calls this structure task_struct. Windows calls it KPROCESS. Different names, same idea.
Without the PCB, multitasking as we know it would be impossible. It’s the foundation on which the whole illusion of “multiple things happening at once” is built.
What Does a PCB Actually Store?
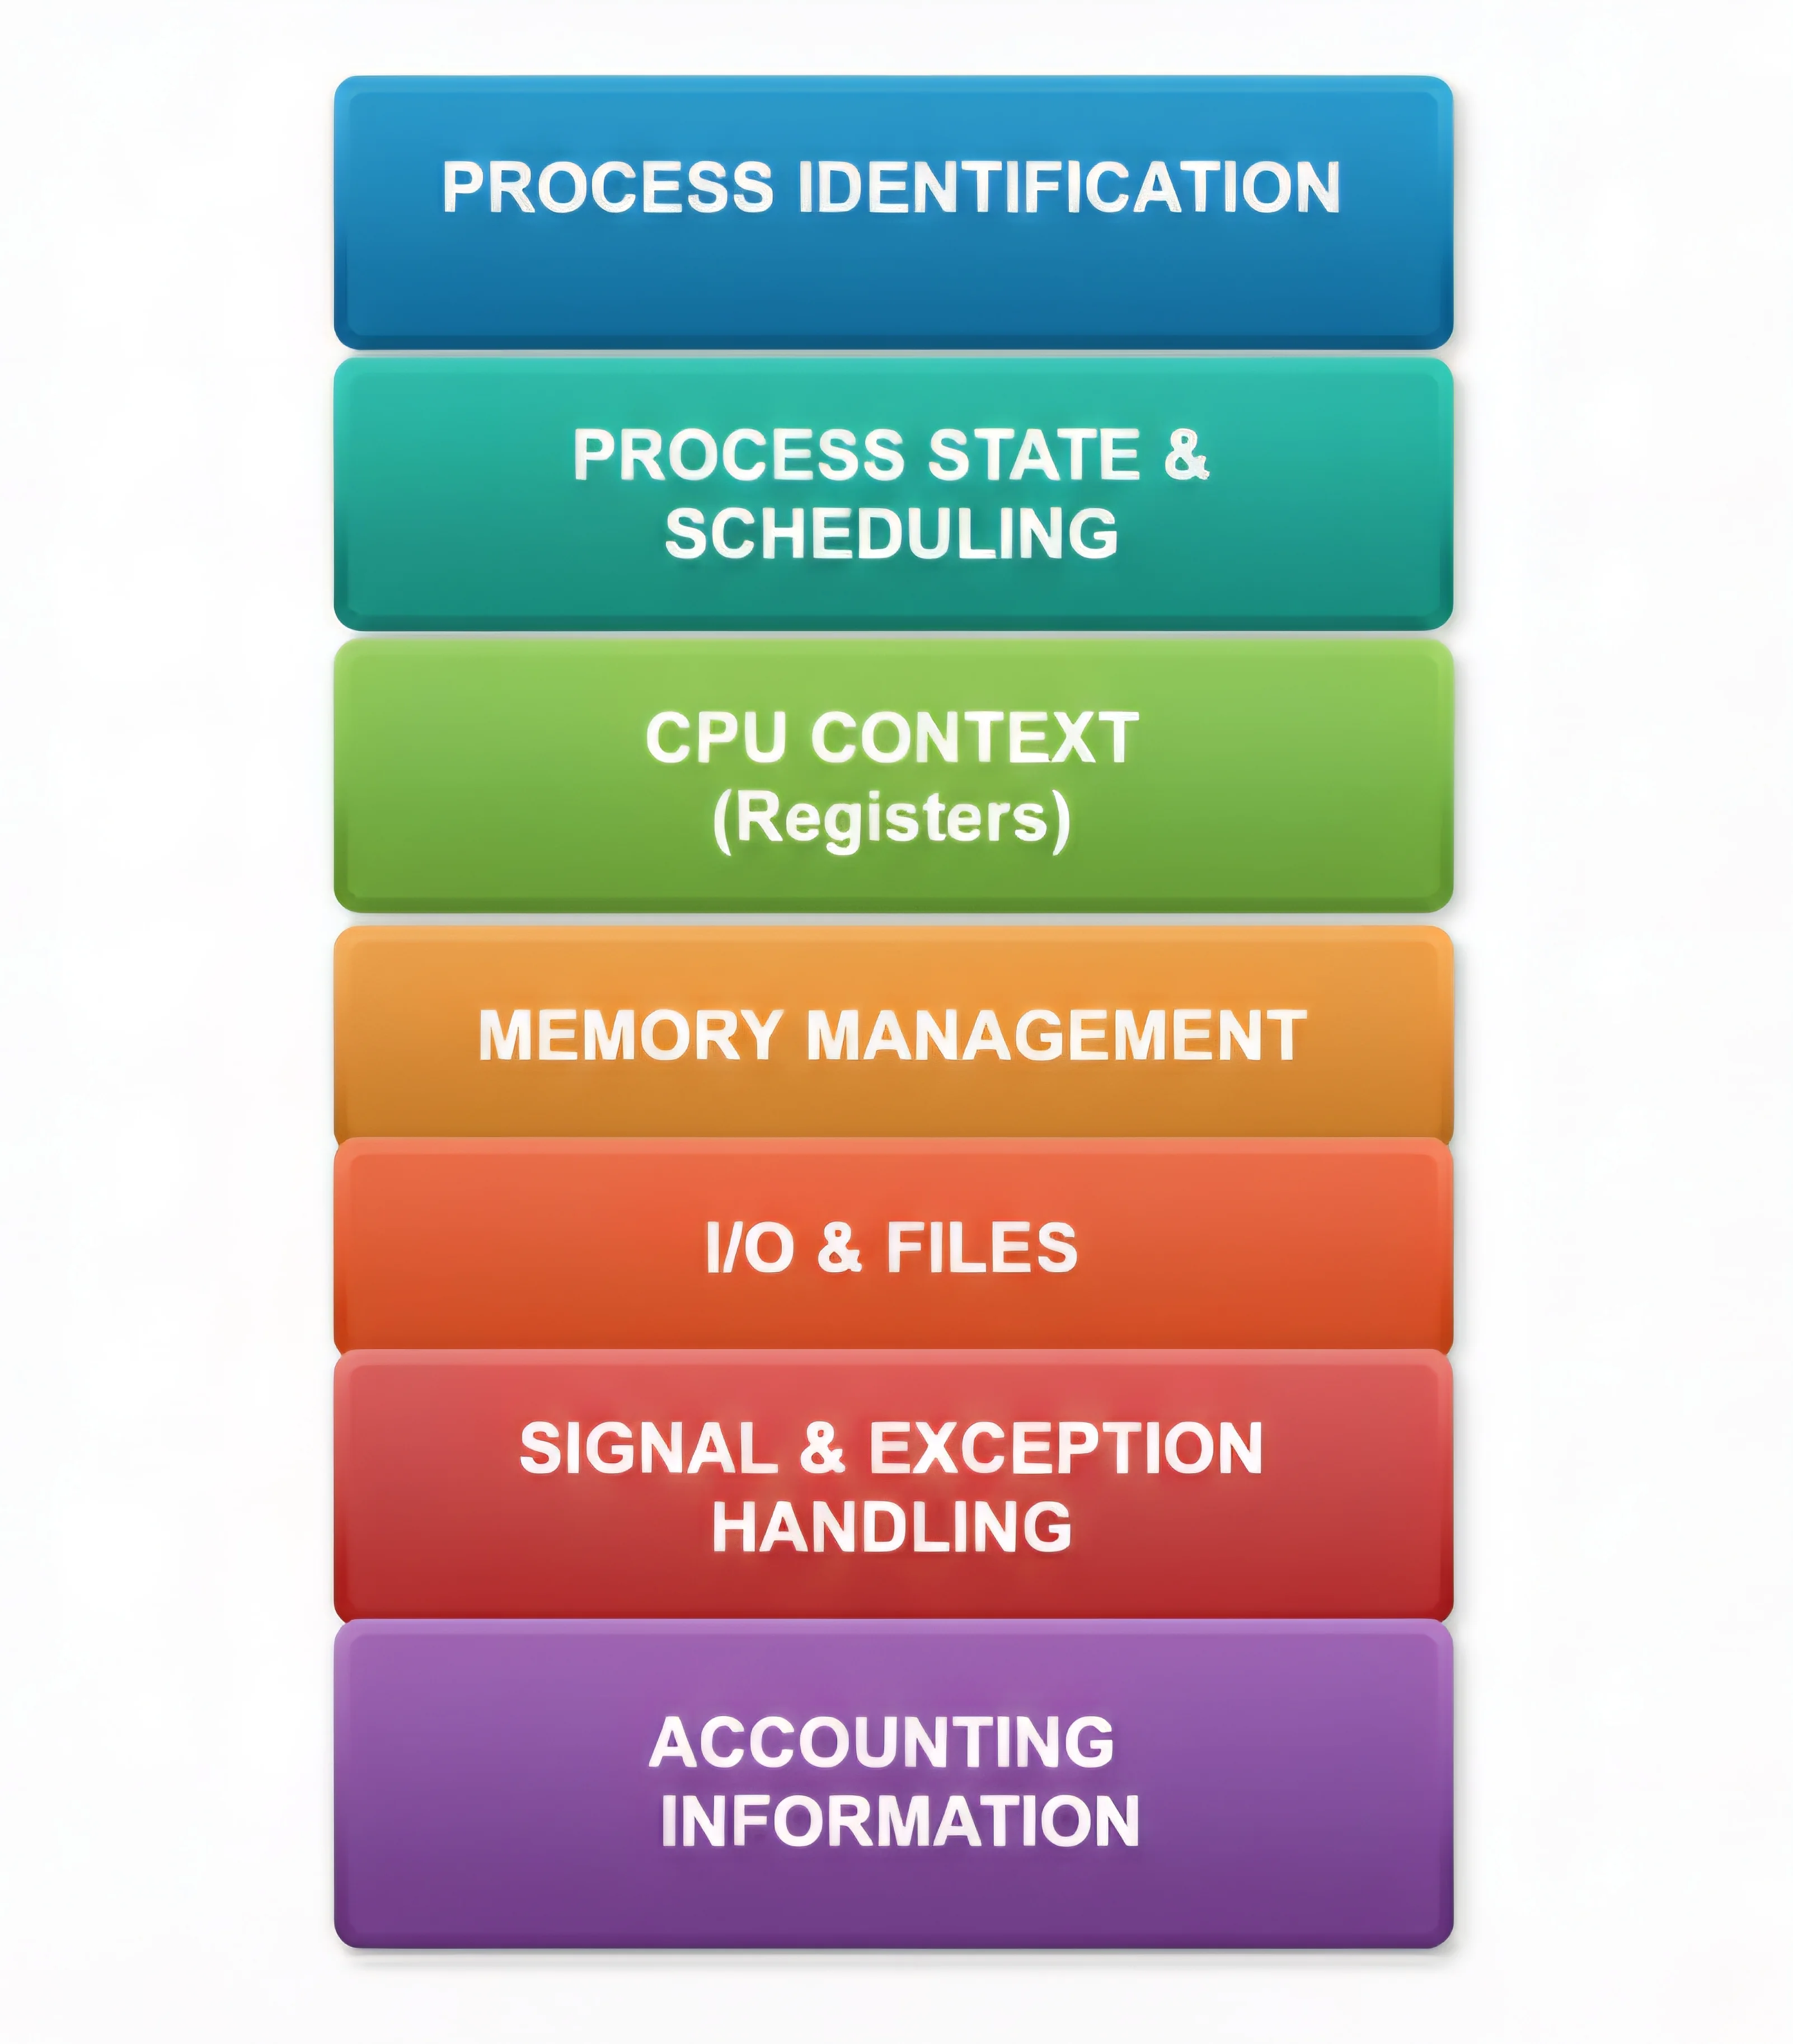
PCB contains all essential information about a process: identification, state, CPU context, memory info, I/O status, and accounting data.
PCB Fields
Identification Fields
Purpose: Allow the OS to uniquely identify and manage each process. These fields uniquely identify a process:
// Example PCB values for a process running "vim"
PID = 1234         // Unique process ID
PPID = 1233        // Parent process ID (bash)
UID = 1000         // User who owns the process
GID = 1000         // Group ID that determine its permissions
Execution State & Scheduling info
Purpose: Help the scheduler decide which process runs when. These fields track the process’s current state and scheduling:
Process State = RUNNING          // Current state
Priority = 20                    // Scheduling priority
Quantum = 10ms                   // Time slice for Round Robin
Queue Links = [next, prev]       // Links to scheduling queues
CPU Context (CPU Registers)
Purpose: Save the exact CPU state so the process can resume exactly where it left off
This is a snapshot of the CPU at a given moment: the Program Counter (which instruction to execute next), the Stack Pointer, all the general-purpose registers, status flags, everything. This is what makes context switching possible.
PC = 0x400500         // Program Counter - next instruction
SP = 0x7ffe0000       // Stack Pointer - top of stack

General Purpose Registers:
  RAX = 0x12345678
  RBX = 0x87654321
  RCX = 0xabcdef00
  RDX = 0xdeadbeef
  RSI, RDI, etc.

Status Register:
  Zero Flag (ZF)
  Carry Flag (CF)
  Overflow Flag (OF)
  Interrupt Flag (IF)
Memory Management
Purpose: Protect process memory and manage virtual-to-physical address translation
This part stores the pointers and permissions that define the process’s memory space — its page table, base and limit registers, and protection flags. This is how the OS ensures one process can’t read or write another process’s memory.
These fields define the process’s memory space:
Base Register = 0x0              // Start of segment
Limit Register = 0x100000        // Max address (1MB size)
Page Table Base = 0x50000000     // Location of page table
Memory Protection = Read/Write/Execute // Permissions
I/O & File Information
Purpose: Track all I/O resources and file operations for the process
// File Descriptor Table
FD[0] = stdin              // Standard input
FD[1] = stdout             // Standard output
FD[2] = stderr             // Standard error
FD[3] = open file "doc.txt"

Current Working Directory = "/home/user/documents"

// I/O Status
Pending I/O = [disk read, network write]
Open Devices = [/dev/tty, /dev/disk1]
Signal Handlers
Purpose: Handle asynchronous events (signals) from the OS or other processes
Signal Handlers:
  SIGTERM → terminate_handler()
  SIGINT  → interrupt_handler()
  SIGCHLD → child_reaper()

Signal Mask = 0x0000FF00         // Which signals are blocked
Accounting Information
Purpose: Track resource usage for billing, scheduling decisions, and monitoring
CPU Time Used = 2500ms           // Total CPU time consumed
I/O Wait Time = 500ms            // Time waiting for I/O
Page Faults = 15                 // Memory access faults
Context Switches = 200           // Times context switched out
Memory Peak = 50MB               // Maximum memory used
The Process Table
It is an array of PCBs maintained by the OS kernel to manage and track all active processes.
Process Table (in Kernel Memory)
┌─────────────────────────┐
│  PCB of Process 1       │ ← PID 1
├─────────────────────────┤
│  PCB of Process 2       │ ← PID 2
├─────────────────────────┤
│  PCB of Process 3       │ ← PID 3
├─────────────────────────┤
│  PCB of Process 4       │ ← PID 4
├─────────────────────────┤
│  ...                    │
├─────────────────────────┤
│  PCB of Process N       │ ← PID N
└─────────────────────────┘

Each entry contains **complete state** of one process
Indexed by **PID** for quick lookup
Peeking at PCB Data on Linux
If you’re curious what this looks like in practice, Linux exposes a lot of PCB-equivalent information through the /proc filesystem:
cat /proc/1234/status    # general process info
cat /proc/1234/stat      # CPU and scheduling data
cat /proc/1234/maps      # memory layout
Running cat /proc/1234/status on a vim process might show you its PID, parent PID, user IDs, current state (sleeping, running), and memory usage. It’s a surprisingly readable window into what the kernel knows about a process.
The PCB must be kept in an area of memory protected from normal process access. In some operating systems, the PCB is placed at the bottom of the process stack to protect it from unauthorized access by user-level code.
Viewing PCB Information
On Linux, you can view PCB information using:
# View process details
ps aux              # Show process list
ps aux | grep vim   # Find specific process

# Detailed process info
cat /proc/PID/status    # See process details
cat /proc/PID/stat      # CPU and scheduling info
cat /proc/PID/maps      # Memory layout

# Real-time monitoring
top                 # Real-time process viewer
htop                # Enhanced top
pidof process_name  # Find process ID
Example output:
$ cat /proc/1234/status
Name:   vim
Pid:    1234
PPid:   1233
Uid:    1000    1000    1000    1000
VmPeak:  50000 kB      # Peak memory usage
VmRSS:   30000 kB      # Current memory usage
State:   S (sleeping)  # Process state